Work / Innovations / ‘Demographics of Tribal Odisha’


Demographics of Tribal Odisha
Web App for Visualizing Demographic Trends in Odisha’s Tribal and PVTG Communities.
Work / Innovations / ‘Demographics of Tribal Odisha’
Demographics of Tribal Odisha
Web App for Visualizing Demographic Trends in Odisha’s Tribal and PVTG Communitiesn
Work / Innovations / ‘Demographics of Tribal Odisha’
Demographics of Tribal Odisha
Web App for Visualizing Demographic Trends in Odisha’s Tribal and PVTG Communities.
Client
Rourkela Smart City Limited
Accessible Via
Standalone Installation (Web App)
Overview
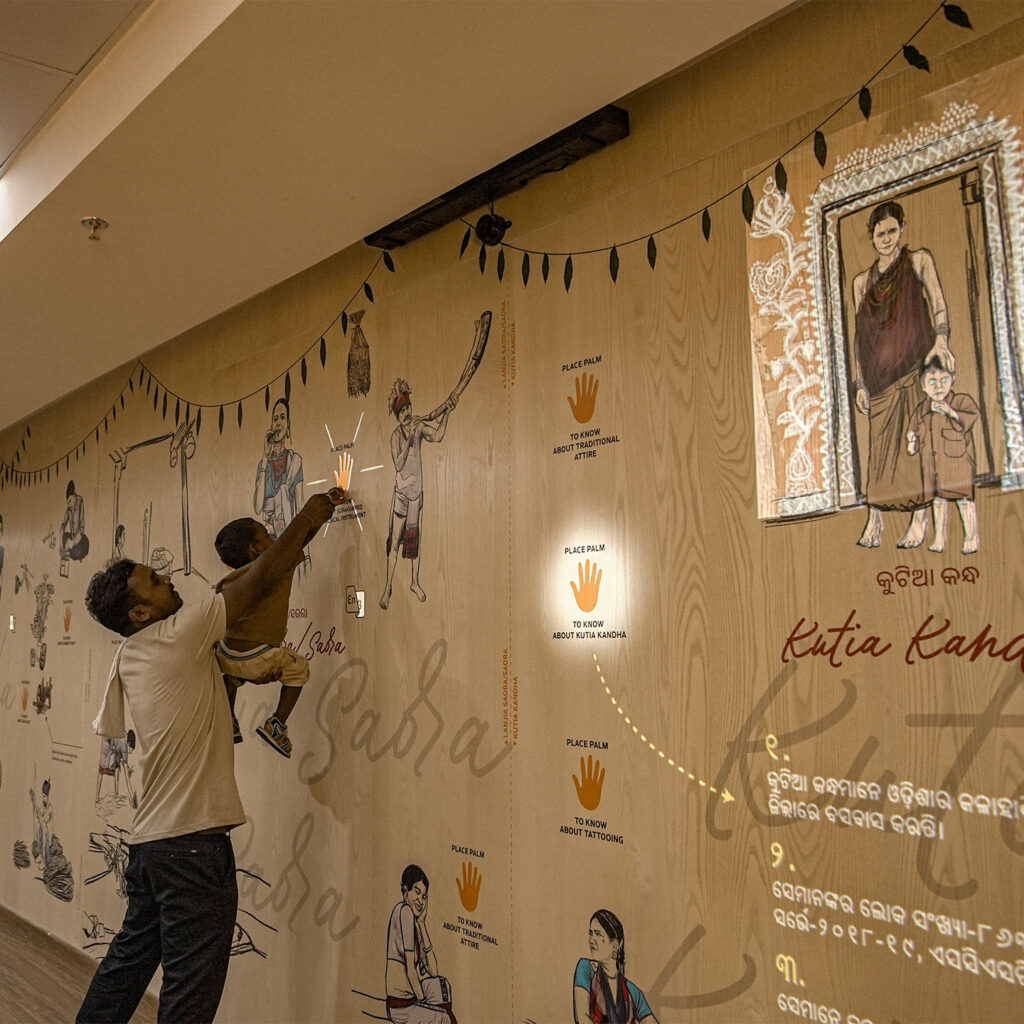
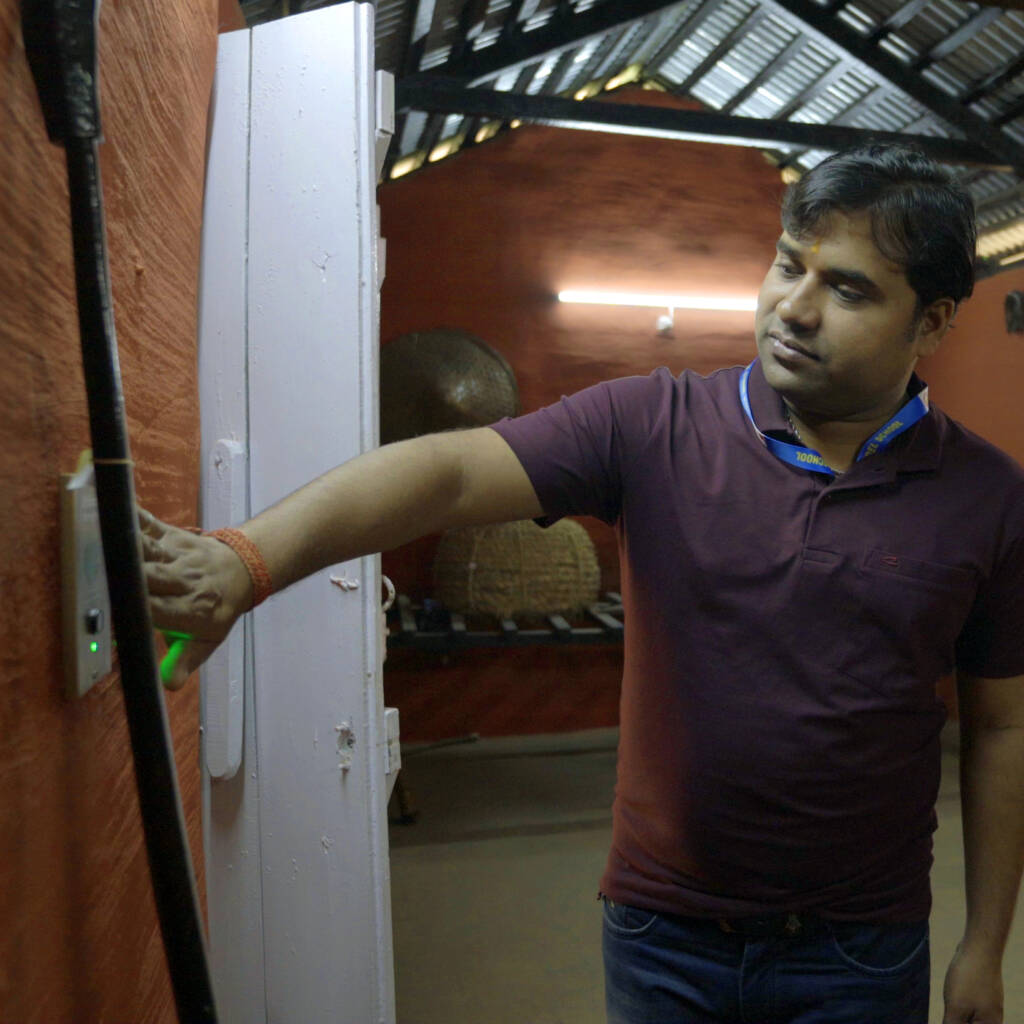
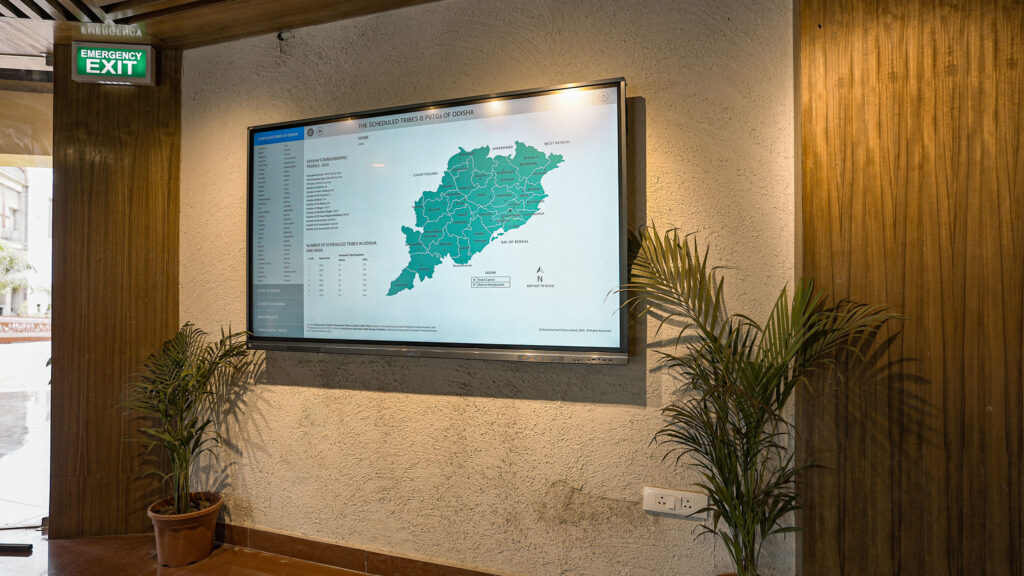
The Interactive Demographic Maps at the Tribal Museum, Rourkela reimagine the conventional map as an engaging digital exploration of the tribal communities and Particularly Vulnerable Tribal Groups (PVTGs) of Odisha. Developed as interactive web-based applications by Myth Interactives, the installations provide visitors with an accessible and visually rich understanding of the distribution, diversity and demographic profile of Odisha’s tribal population.
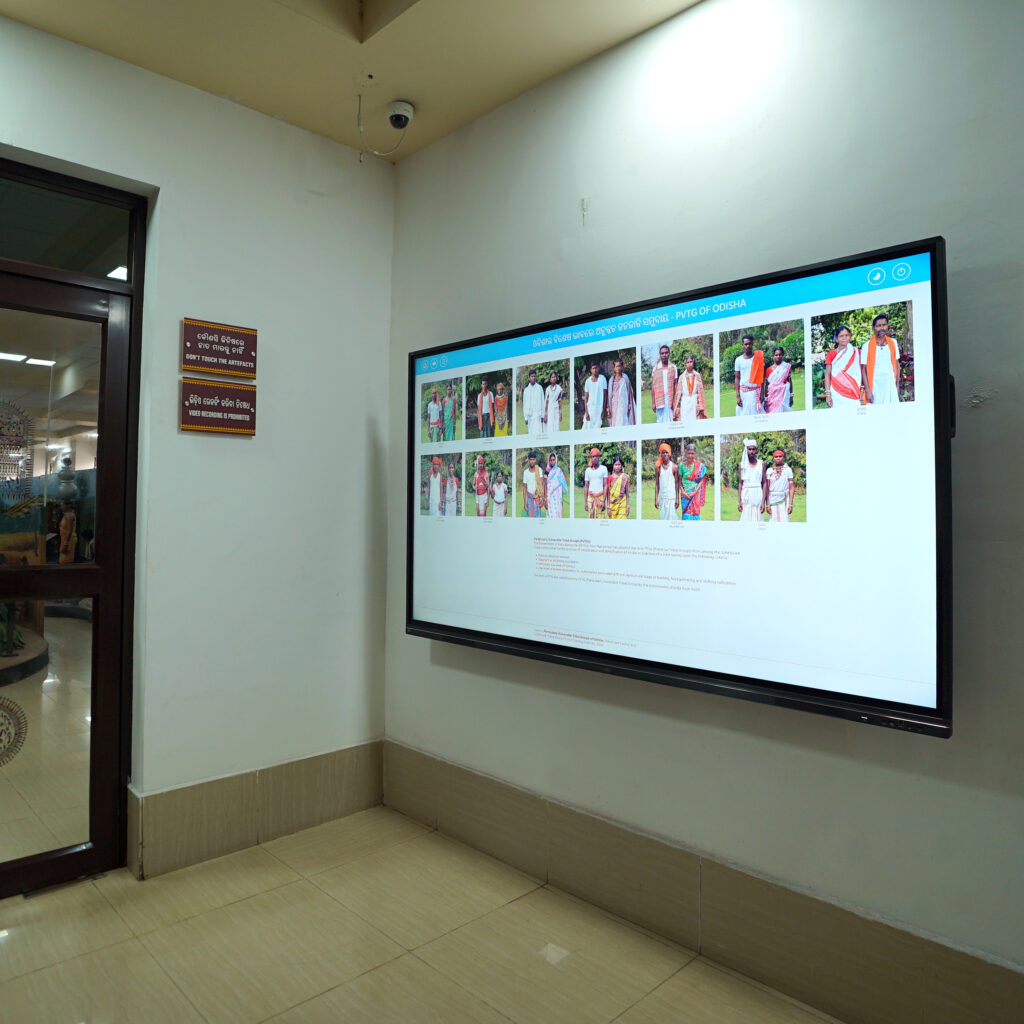
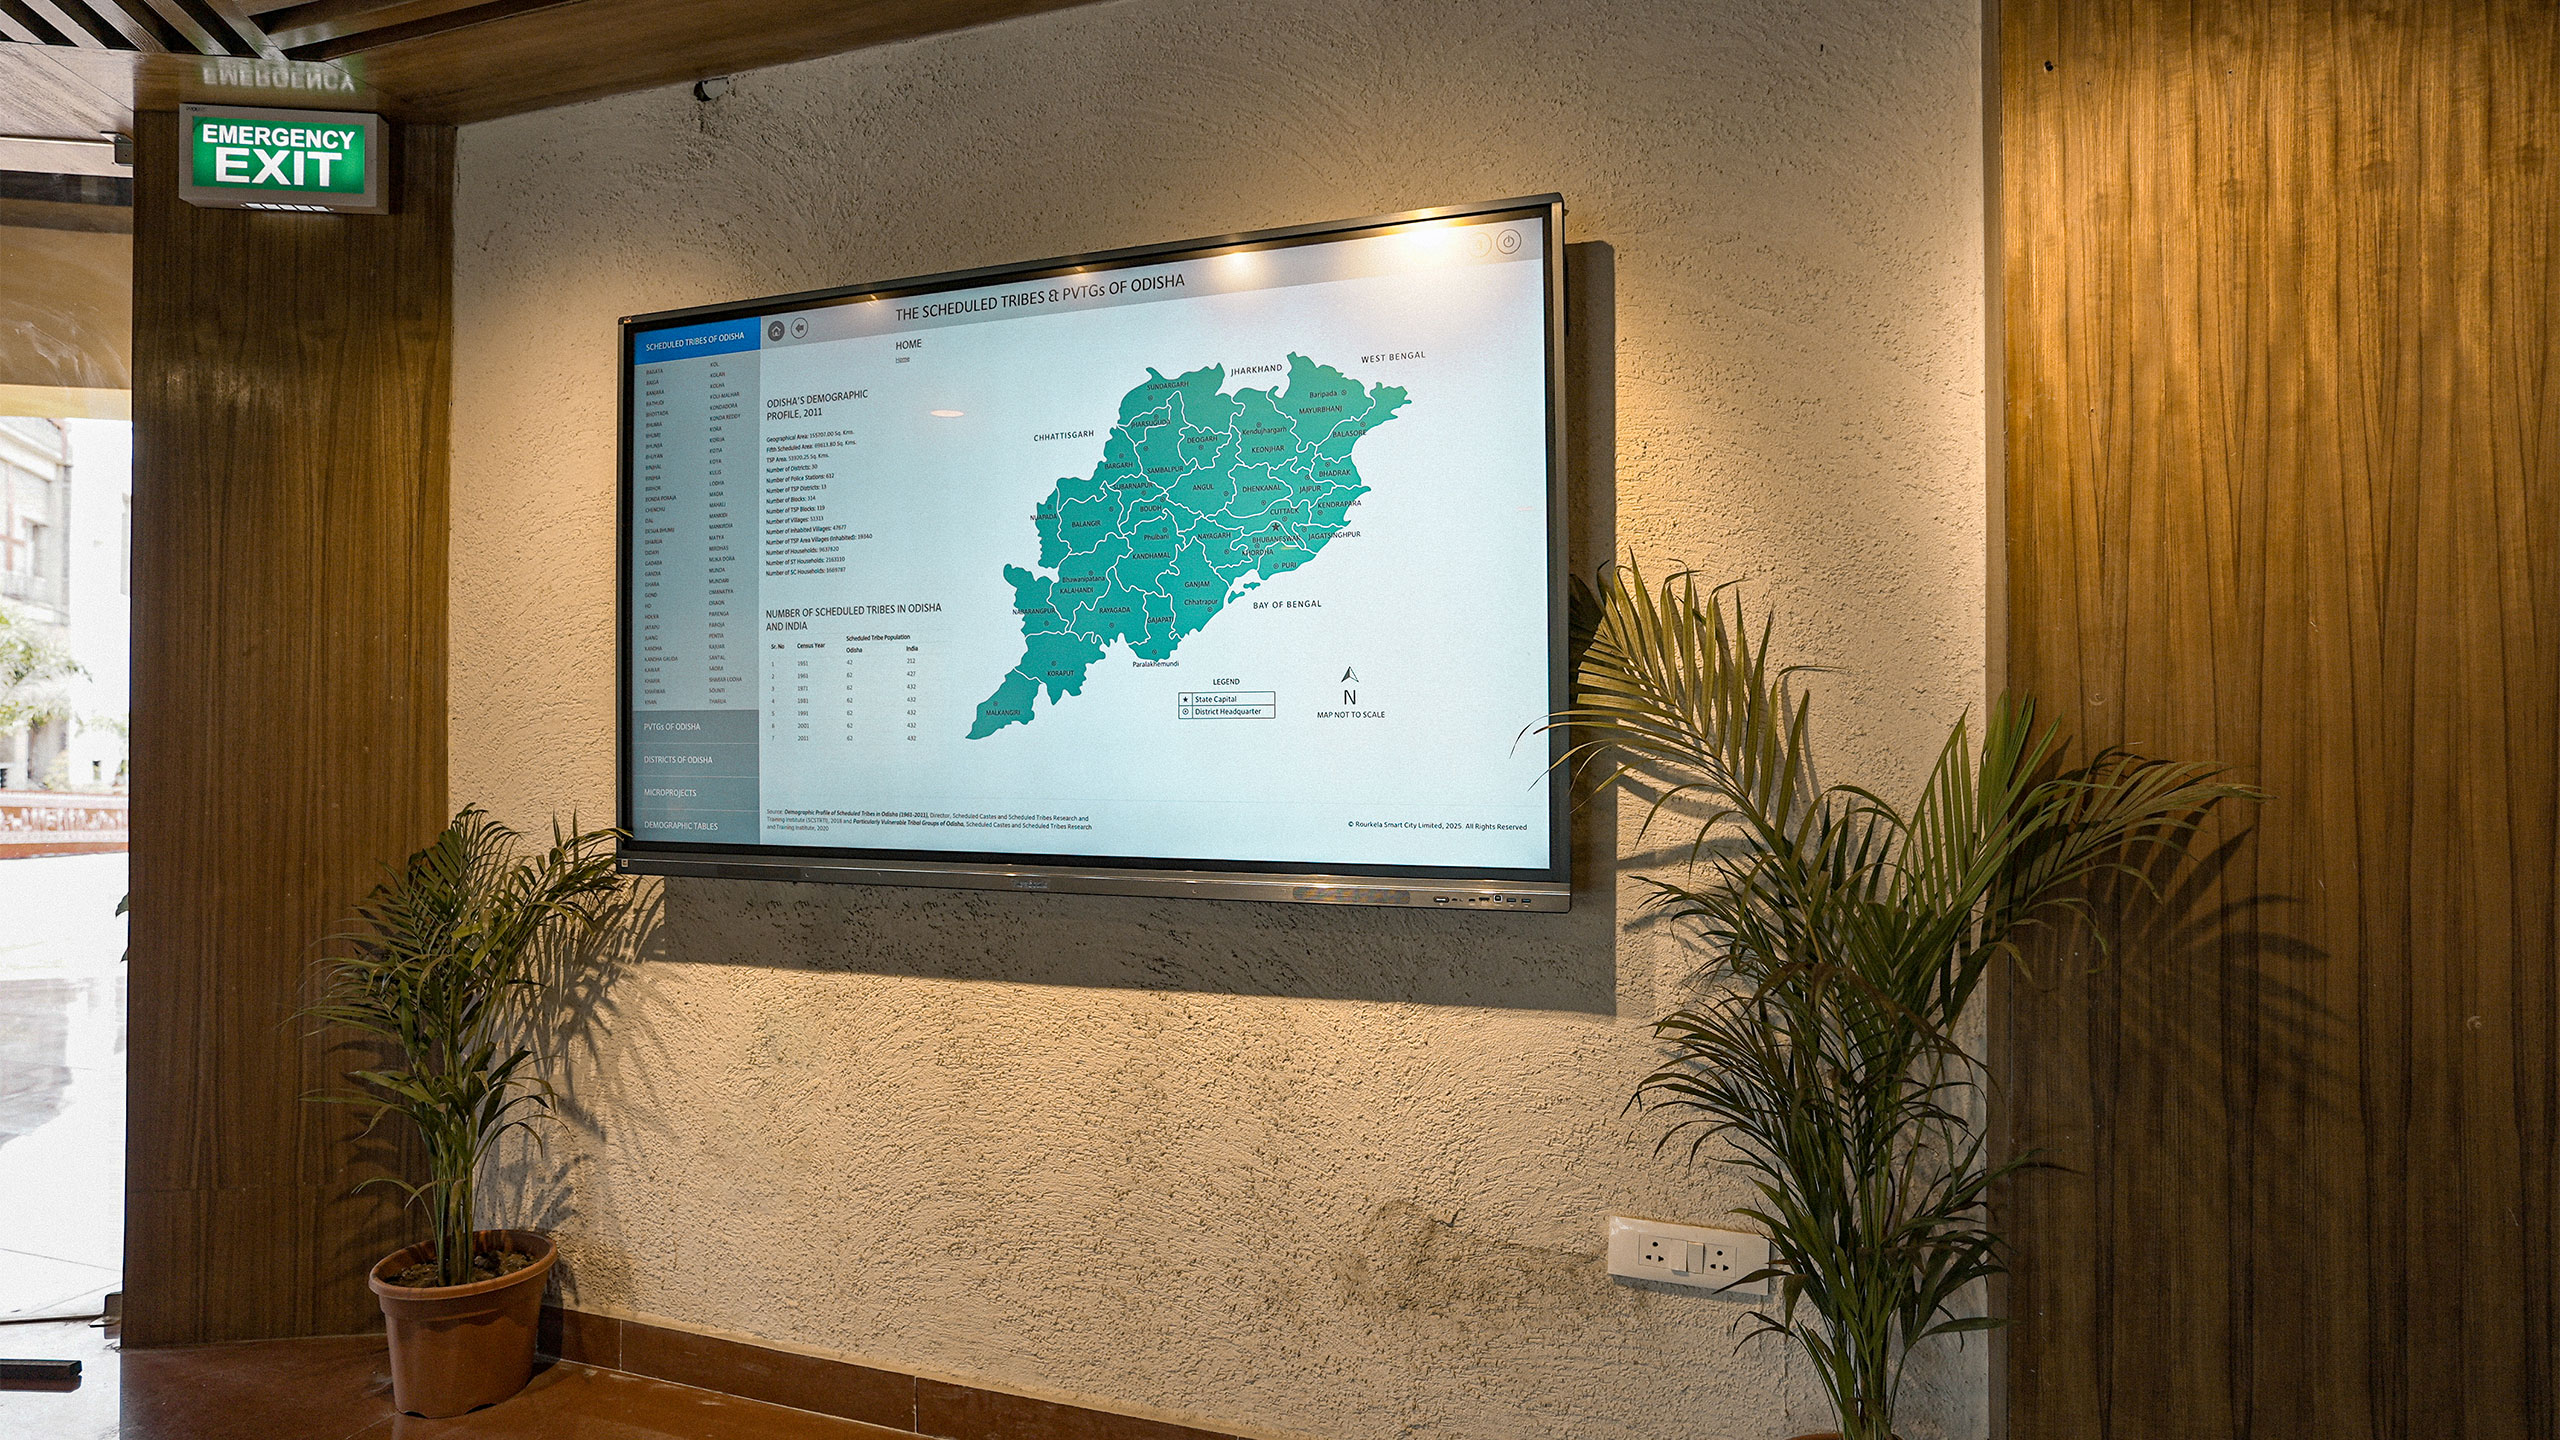
The interactive maps present detailed information on tribal communities and PVTGs through dynamic maps, charts, graphs and comparative visualisations. Visitors can explore socio-cultural aspects including language, occupation, religion and festivals alongside demographic indicators such as population, literacy, sex ratio, growth trends and working population statistics. The system also enables comparative study between multiple communities, allowing users to better understand the diversity and distinct identities of Odisha’s tribal groups.
In addition, the installation provides reference information on Scheduled Areas, Tribal Sub-Plan (TSP) regions, Integrated Tribal Development Agencies (ITDAs), Microprojects and MADA pockets, making the exhibit both an educational and research-oriented digital resource within the museum space.
Services
- Concept
- Media Production
- Graphic Design
- Software (App) Development
- Interaction Design
- Installation and on-site support for hardware
Tags
Share
Client
Rourkela Smart City Limited
Accessible Via
Standalone Installation (Web App)
Overview
The Interactive Demographic Maps at the Tribal Museum, Rourkela reimagine the conventional map as an engaging digital exploration of the tribal communities and Particularly Vulnerable Tribal Groups (PVTGs) of Odisha. Developed as interactive web-based applications by Myth Interactives, the installations provide visitors with an accessible and visually rich understanding of the distribution, diversity and demographic profile of Odisha’s tribal population.
The interactive maps present detailed information on tribal communities and PVTGs through dynamic maps, charts, graphs and comparative visualisations. Visitors can explore socio-cultural aspects including language, occupation, religion and festivals alongside demographic indicators such as population, literacy, sex ratio, growth trends and working population statistics. The system also enables comparative study between multiple communities, allowing users to better understand the diversity and distinct identities of Odisha’s tribal groups.
In addition, the installation provides reference information on Scheduled Areas, Tribal Sub-Plan (TSP) regions, Integrated Tribal Development Agencies (ITDAs), Microprojects and MADA pockets, making the exhibit both an educational and research-oriented digital resource within the museum space.
Services
- Concept
- Media Production
- Graphic Design
- Software (App) Development
- Interaction Design
- Installation and on-site support for hardware
Tags
Share
Client
Rourkela Smart City Limited
Accessible Via
Standalone Installation (Web App)
Overview
The Interactive Demographic Maps at the Tribal Museum, Rourkela reimagine the conventional map as an engaging digital exploration of the tribal communities and Particularly Vulnerable Tribal Groups (PVTGs) of Odisha. Developed as interactive web-based applications by Myth Interactives, the installations provide visitors with an accessible and visually rich understanding of the distribution, diversity and demographic profile of Odisha’s tribal population.
The interactive maps present detailed information on tribal communities and PVTGs through dynamic maps, charts, graphs and comparative visualisations. Visitors can explore socio-cultural aspects including language, occupation, religion and festivals alongside demographic indicators such as population, literacy, sex ratio, growth trends and working population statistics. The system also enables comparative study between multiple communities, allowing users to better understand the diversity and distinct identities of Odisha’s tribal groups.
In addition, the installation provides reference information on Scheduled Areas, Tribal Sub-Plan (TSP) regions, Integrated Tribal Development Agencies (ITDAs), Microprojects and MADA pockets, making the exhibit both an educational and research-oriented digital resource within the museum space.
Services
- Concept
- Media Production
- Graphic Design
- Software (App) Development
- Interaction Design
- Installation and on-site support for hardware
Tags
Share